Analysis of the Supply and Demand of the Metal Can Industry in 2021
The metal packaging box has a history of more than 70 years. In the early 1930s, the United States began to produce beer metal boxes. This three-piece can is made of tinplate. The upper part of the can is cone-shaped and the top is crown-shaped can lid. Its general appearance is not too different from that of glass bottles, so it was initially filled with glass bottle filling lines. It was not until the 1950s that there was a dedicated filling line. The can lid evolved into a flat shape in the mid-1950s and was improved into an aluminum ring lid in the 1960s.
Aluminum metal beverage cans first appeared in the late 1950s, and two-piece DWI cans officially came out in the early 1960s. The development of aluminum cans is very rapid. By the end of this century, the annual consumption has exceeded 180 billion, which is the largest category in the world’s total metal cans (about 400 billion). The consumption of aluminum materials used to manufacture aluminum cans is also growing rapidly. In 1963, it was close to zero. In 1997, it reached 3.6 million tons, which is equivalent to 15% of the total consumption of various aluminum materials in the world.
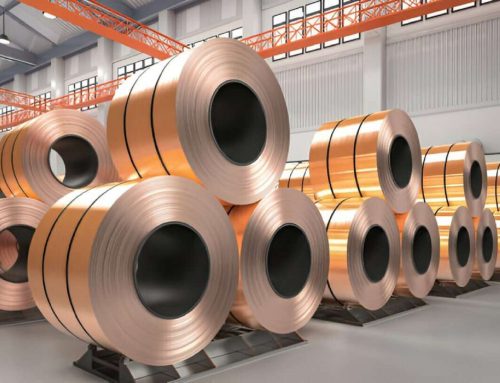
Analysis of the supply of metal cans
Global metal can production has declined
According to data from the United Nations Industrial Organization, from 2015 to 2020, global iron and iron plate production has increased year by year. In 2017, global iron and iron plate production reached 415 million tons, reaching the peak of iron box and iron plate production in recent years. In 2018, the global output of iron and iron plate declined, reaching 409 million tons, a decrease of 1.45% from 2017. In 2019, global iron and iron plate production reached 404 million tons, down 1.22% from 2018.
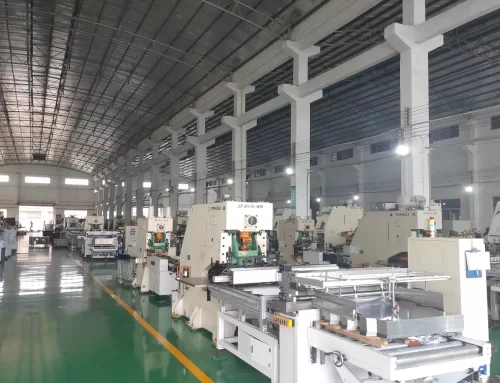
China is a global metal can manufacturing center
At present, the Asia-Pacific region (mainly East Asia), Europe (mainly Western Europe) and North America are still the three major centers of the global metal can manufacturing industry. However, the metal can manufacturing market in Europe and North America has been saturated, and the development potential is affected by market capacity. Restrictions, and the Asia-Pacific region is becoming the engine of the development of the global metal can manufacturing industry.
In 2019, China’s metal can production accounted for the highest proportion of global production at 26.63%; followed by the United States, which accounted for 16.86%. Japan and Germany followed closely, with their metal can production accounting for 6.28% and 5.46% of the world’s output, respectively.
Global metal can trade data
China’s metal can imports decreased in 2019, with Germany and the United States as the main metal can importers
From the perspective of global trade data, from 2015 to 2018, the global trade volume of metal cans showed a fluctuating and rising trend. In 2018, the global import volume of raw iron plates for metal cans was 116 million tons, and the import value was 107.9 billion U.S. dollars, an increase of 10.10% from 2017; in 2019, global iron plate imports declined, with 110 million tons of imports. The amount was 98.6 billion U.S. dollars, a decrease of 8.62% from 2018.
In the metal can market trade, the main importing countries are Germany, the United States and France. In 2019, Germany was the country that imported the most metal tank plates in the world, with a total of 96.6 million imports, accounting for 8.74%, ahead of other countries’ imports; the United States ranked second in terms of imports, and its imports in 2019 The number is 90.4 million, accounting for 8.18%; China’s import of metal cans in 2019 is 55.4 million, accounting for 5.02%, ranking third.
Export volume of metal cans will decrease in 2020
From the perspective of exports, from 2015 to 2020, the global export volume of metal cans will fluctuate and rise. In 2018, the global export volume of metal cans was 1.017 billion U.S. dollars, and the export value was 104.5 billion U.S. dollars, an increase of 7.07% from 2017; in 2019, global paper and paper exports declined, with the export volume of 1.013 billion and the export value of 96.2 billion U.S. dollars, a decrease of 7.94% compared to 2018.
In the metal can market trade, the main exporting countries are China, Japan and India. In 2019, China is the world’s largest exporter of metal cans, with a total export volume of 135 million, accounting for 11.96%; Japan ranked second in export volume, and its export volume in 2020 is 105.7 million, accounting for 9.37% ; India’s export volume of metal cans in 2019 was 92.9 million, accounting for 8.24%, ranking third.
The price of metal cans fluctuates
Judging from the average import and export prices of metal cans, the overall price of metal cans has shown a trend of volatility in recent years. In 2018, the price of metal cans reached the highest level in recent years, at US$9,130.93/ton; in 2019, the price of paper decreased to US$872.32/ton, a year-on-year decrease of 4.55%.
Metal can demand market
Demand for metal cans has declined
According to statistics from the United Nations Industrial Organization, from 2015 to 2019, the change trend of the global metal can market demand is similar to the change trend of iron plate production. In 2019, global iron plate consumption reached 402 million tons, a year-on-year decrease of 1.47%.
The revenue of the metal can manufacturing industry generally decreases in 2020
From the perspective of the revenue of major metal can manufacturing enterprises, under the influence of the unstable factors of the epidemic in 2020, the prosperity of the global metal can manufacturing industry will continue to be low. Among the ten companies on the list, except for Baili and Graphic Packaging Group, which showed positive revenue growth, the rest of the companies showed negative growth.
Supply and demand in the metal can industry are relatively balanced
From the perspective of the production and sales rate, the production and sales of the metal can manufacturing industry in 2015-2019 are relatively balanced, with the production and sales rate between 99% and 100%. The production-sales ratio in 2019 was 99.41%, a decrease of 0.39 percentage points from 2018.